Data Science
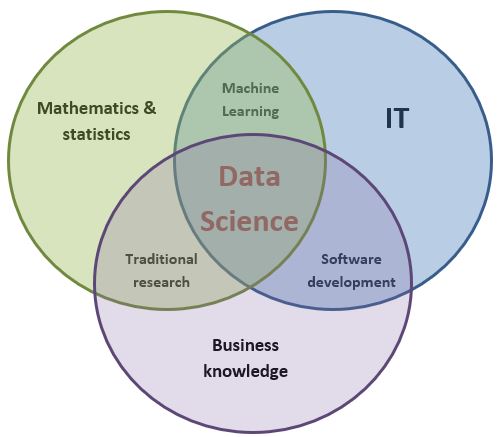
Data Science is an interdisciplinary field geared to analyzing large data sets to extract knowledge. Its methods are drawn from computing, statistics, machine learning, data analysis and decisional mathematics.
Data Science is used to exploit data to model behaviors, take decisions, or make predictions using algorithms.
So Data Science comprises tools and methods that enable you to:
- Structure and organize data in databases, data warehouses and data marts, using ontologies and big data as needed;
- Gather, integrate and aggregate data from several, potentially disparate sources, using ETL tools;
- Validate, check and clean the data, for instance using business rules (BRMS);
- Visualize and disseminate the data in the form of dashboards and reporting, using BI (Business Intelligence) and data viz tools;
- Learn from this data, by using statistical and machine learning algorithms: linear regression (simple, multiple), logistic regression, clustering (K-means, KNN, DBSCAN, etc.), decision trees and random decision forests (Random Forest), Support Vector Machines (SVM), neural networks, boosting time series, principal component analysis, factorial correspondence analysis, text mining, reinforcement learning and so on.
Why Data Science?
Decision makers can rely on Data Science in competitive environments where data is constantly circulating, to analyze their data to reveal hidden data that can assist in taking more informed decisions about their businesses. These data-driven decisions may lead to higher profitability, enhanced operational efficiency, optimized commercial performance and better workflows. Examples of this in the distribution, banking, industry and transport sectors are:$
- Demand forecasting, sales forecasting
- Detecting fraud
- Customer classification and scoring
- Dynamic pricing and price recommendations
- Product recommendations from customer experience
- Image, video, text and other media analysis and recognition
- Troubleshooting
- Preventive maintenance.
Data Science in practice
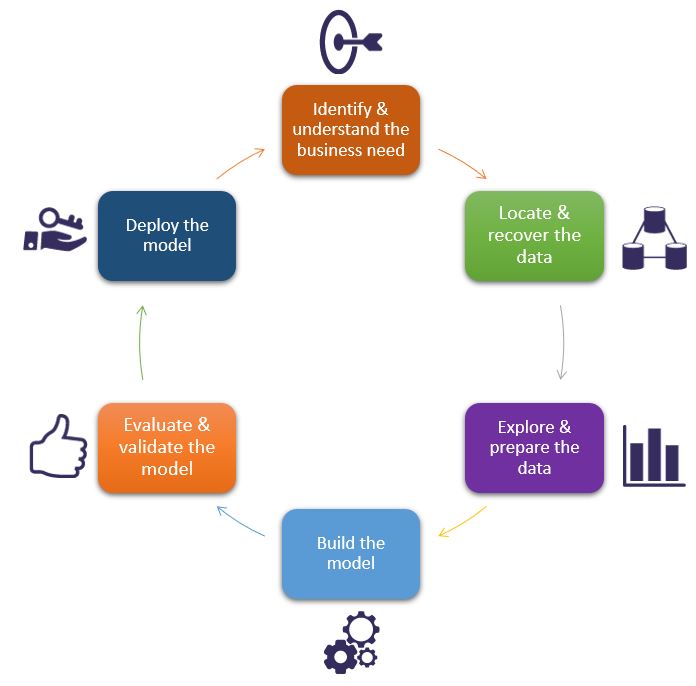
To see through a Data Science project and ensure that it runs smoothly, it is vital to follow all the lifecycle stages that are shown in the following flowchart.
In the first stage, the business need, various specifications, requirements and priorities must be grasped.
Then, the data required to develop the solution must be identified, and in turn recovered and stored (operational databases, files, website, etc.).
The third stage involves data preparation – data classification by the chosen criteria, data cleaning (to handle missing data), and above all data recoding to make it compatible with the algorithms that will be used (Features Engineering).
The fourth stage is that of modeling, namely choosing algorithms, their configuration and testing. This is followed by the assessment stage to verify the model(s) or knowledge obtained to ensure that they meet the project’s initially expressed goals. Then the model’s robustness is assessed for its readiness to be rolled out, failing which improvements may be needed. Deployment of the developed models for the end users completes the lifecycle.
The Data Scientist’s toolbox
Examples of tools frequently used at EURODECISION for Data Science projects:
- Databases: Oracle, MySQL, PostGreSQL
- ETL: Talend
- Big Data: Hadoop, Spark
- “Statistics & machine learning” platforms: R, Python
- BI and data viz tools: Qlikview/Qliksense, SiSense, PowerBI, Looker, Tableau
- BRMS tools: Drools, ODM (JRules)